


atop is a real-time system monitoring tool for Linux-based operating systems. It provides detailed information about system performance, including CPU, memory, disk, network interface and other resource usage.
Features of atop
Key features of atop include:
- Real-time monitoring: allows you to monitor system status in real time, updating information every few seconds.
- Historical dаta: can save system performance data to a file for later analysis. This allows the user to view performance information for specific time periods.
- Detailed information: atop provides detailed information about each process, including CPU, memory, I/O and network resource usage.
- Multithreading support: can display threading information, which is useful for analyzing multithreaded applications.
- Graphical interface: although atop is a command-line tool, it can be used with graphical interfaces to visualize data.
The main components of atop's operation are
Data collection
atop collects information about system state, including CPU, memory, disk, network interface, and process usage. It uses system calls and interfaces such as /proc to obtain information about current resource states.
Displaying information
After collecting data, atop displays it in a readable format in the terminal. The data is updated every few seconds (the default is every 10 seconds). The information is presented in the form of tables, where you can see the resource utilization at the system and process level.
Historical data
atop can save collected data to a file for later analysis. This allows users to view performance information for specific time intervals. This is done using a command line flag that points to a file to write the data to.
Analyzing processes
atop provides detailed information about each running process, including CPU, memory, I/O and network resource utilization. Users can sort processes by various criteria (such as CPU or memory utilization) to quickly identify bottlenecks.
Interactive interface
Users can control the display of information through various commands (e.g. filtering processes, changing the refresh interval, etc.). The q key is used to exit the program.
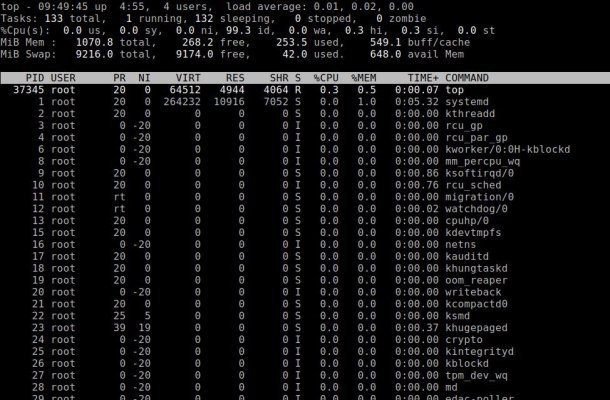
Example of operation
When you run atop, you may see something like this:
ATOP - all-in-one performance monitor 12:00:00 up 1 day, 3:45, 2 users, load average: 0.01, 0.05, 0.10 CPU total 1.50 0.00 0.00 0.00 0.00 0.00 Mem total 800000000 500000 500000 300000 100000 Swap total 200000000 100000 50000 50000 50000 PID USER COMMAND %CPU %MEM VIRT RES 1234 user1 my_process 0.50 1.00 100M 20M 5678 user2 another_process 0.00 0.50 0.50 50M 10M
Installation
In most Linux distributions atop can be installed via the package manager.
For Ubuntu/Debian:
sudo apt install atopFor CentOS/RHEL:
sudo yum install atopUsage
To start atop, simply type the command in the terminal:
atopBy default, it will update every 10 seconds. You can change this interval by specifying it as an argument:
atop 5This will update every 5 seconds.
Exit the program
To exit atop, press q.
Conclusion
atop is a powerful tool for system administrators and developers to effectively monitor and analyze system performance in real time and over specific time intervals.