


Grafana is a platform that lets you build clear, convenient dashboards for monitoring your infrastructure and applications. Think of it as a storefront for dаta: Grafana connects to sources of metrics, logs, and traces, visualizes them in dashboards, and can send notifications when something goes wrong. Because of this, Grafana often becomes a central hub that developers, administrators, and operations engineers all use to quickly assess the health of services.
Why Grafana is needed
When a project is just starting out, monitoring often looks like a set of disconnected checks: somewhere you look at server load, somewhere you read logs, somewhere you keep “normal” latency and error values in your head. As the project grows, this approach stops working: there is more data, more systems, and less time for manual diagnostics.
This is where Grafana comes in, addressing several common tasks at once:
— See the full picture quickly. A single screen can show infrastructure, application metrics, and basic business indicators.
— Spot problems early. For example, increasing latency or a gradual rise in error rates.
— Reduce incident investigation time. With well-designed dashboards, half of the questions are answered in the first few minutes.
This is especially valuable in production: even small time savings during diagnostics often turn into noticeable savings of money and stress.
Metrics, logs, traces: the building blocks of observability
To get real value from Grafana, it’s important to understand what kinds of data it works with and how they differ.
— Metrics are time-series numerical dаta: CPU load, requests per second, error rates, response times. Metrics are ideal for charts, trends, and alerts.
— Logs are events. They answer the question “what exactly happened” and often contain crucial details: error messages, request parameters, stack traces.
— Traces show the path of a request through services. If a request goes through an API, then an auth service, then a database, then a queue, tracing reveals where latency or errors occur.
Grafana can work with all three data types and link them together.
How Grafana is structured
In practice, Grafana consists of several core building blocks that are useful to understand upfront.
Data sources
These are connections to systems where your metrics, logs, or other data live. Grafana knows how to query these systems and interpret their responses. You can connect a single data source or dozens of them, depending on scale.
Dashboards and panels
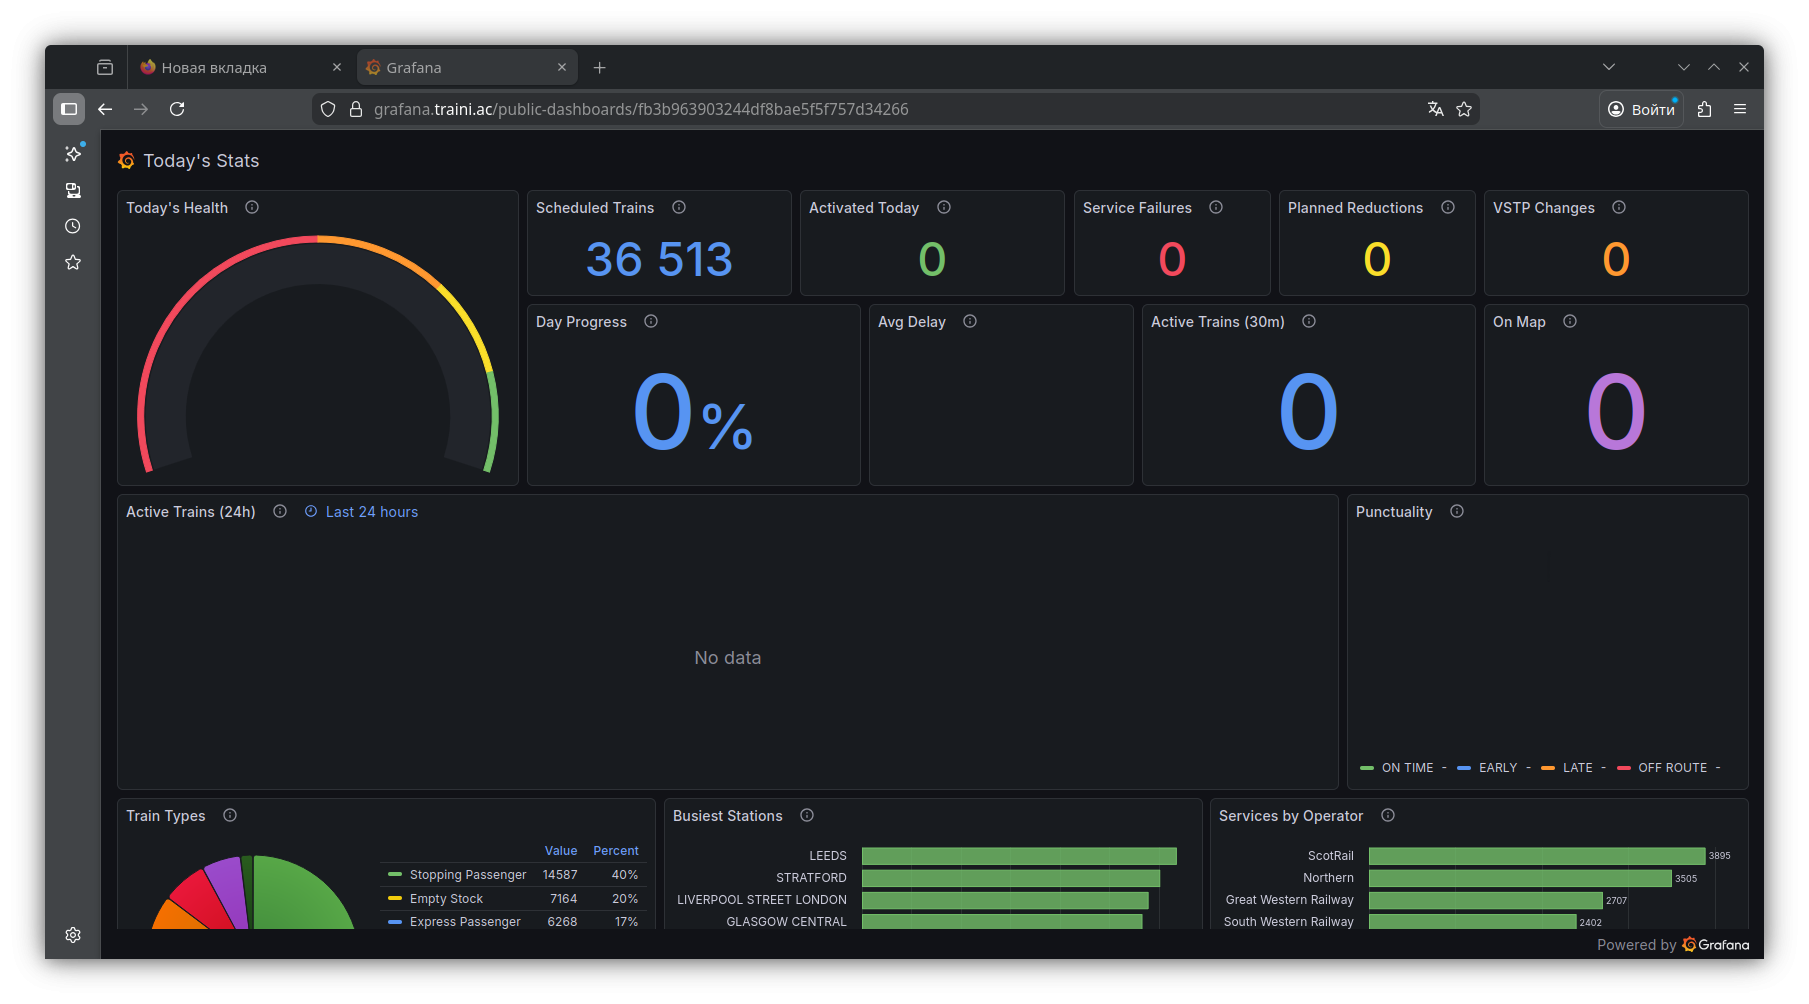
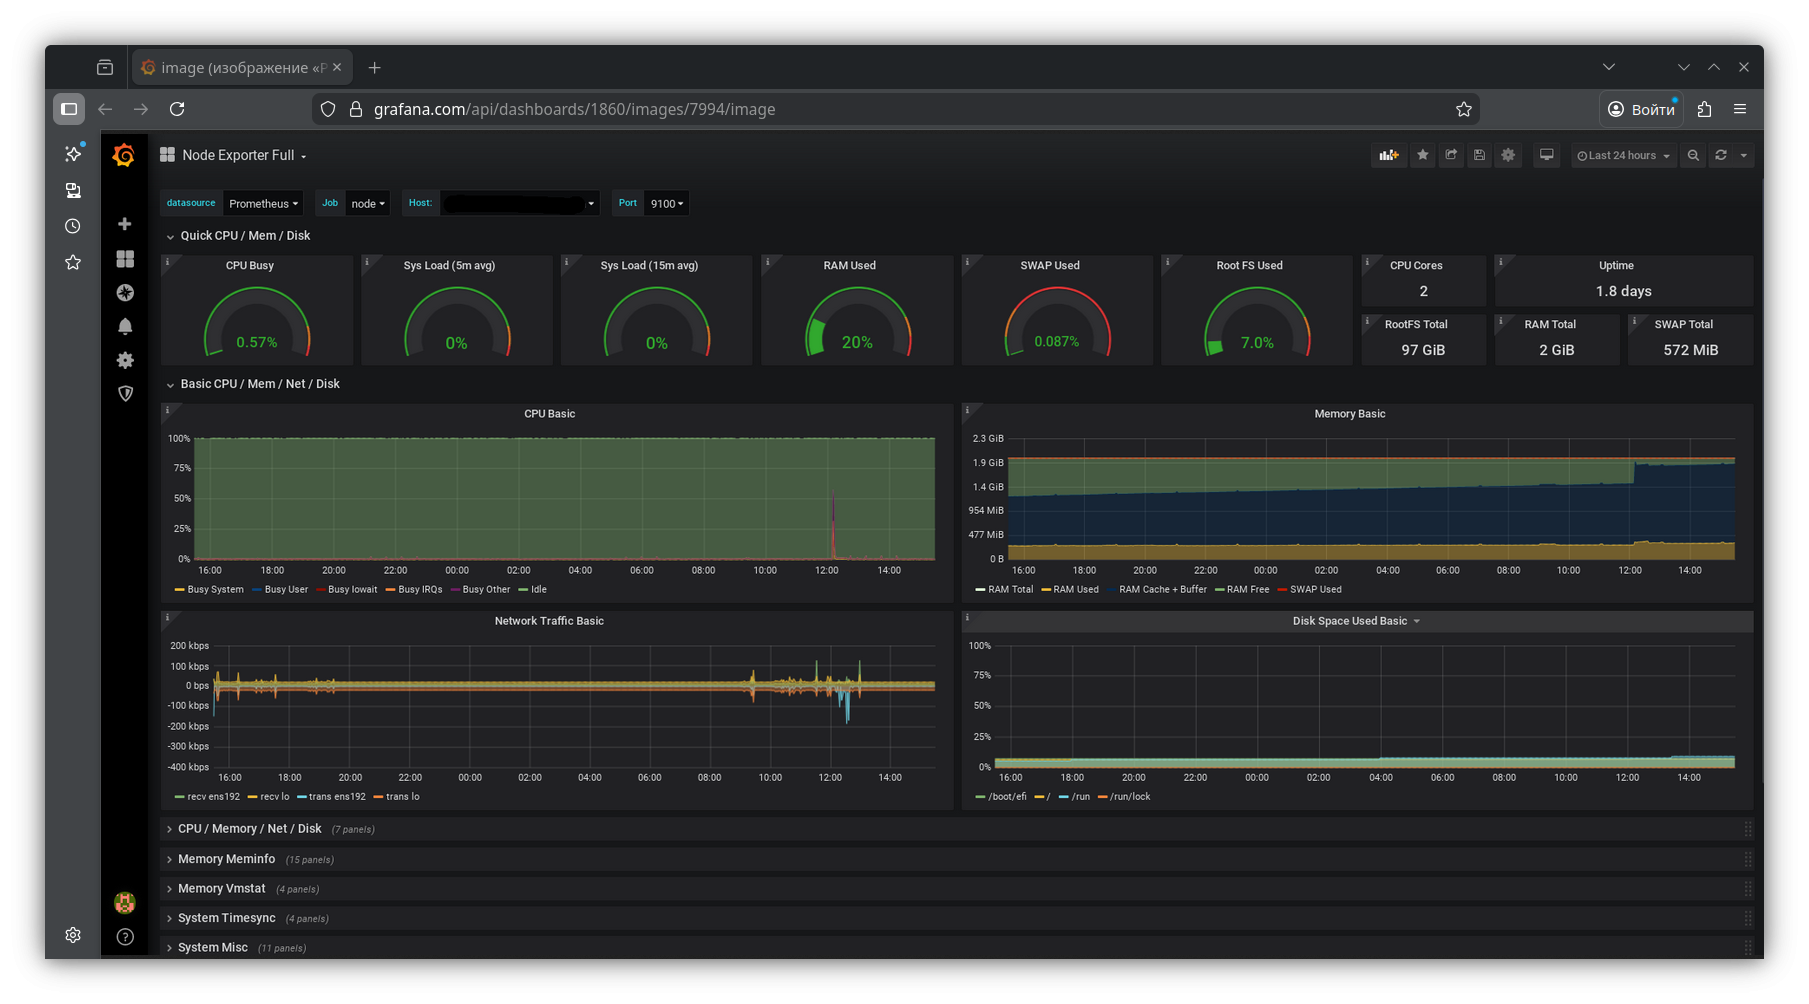
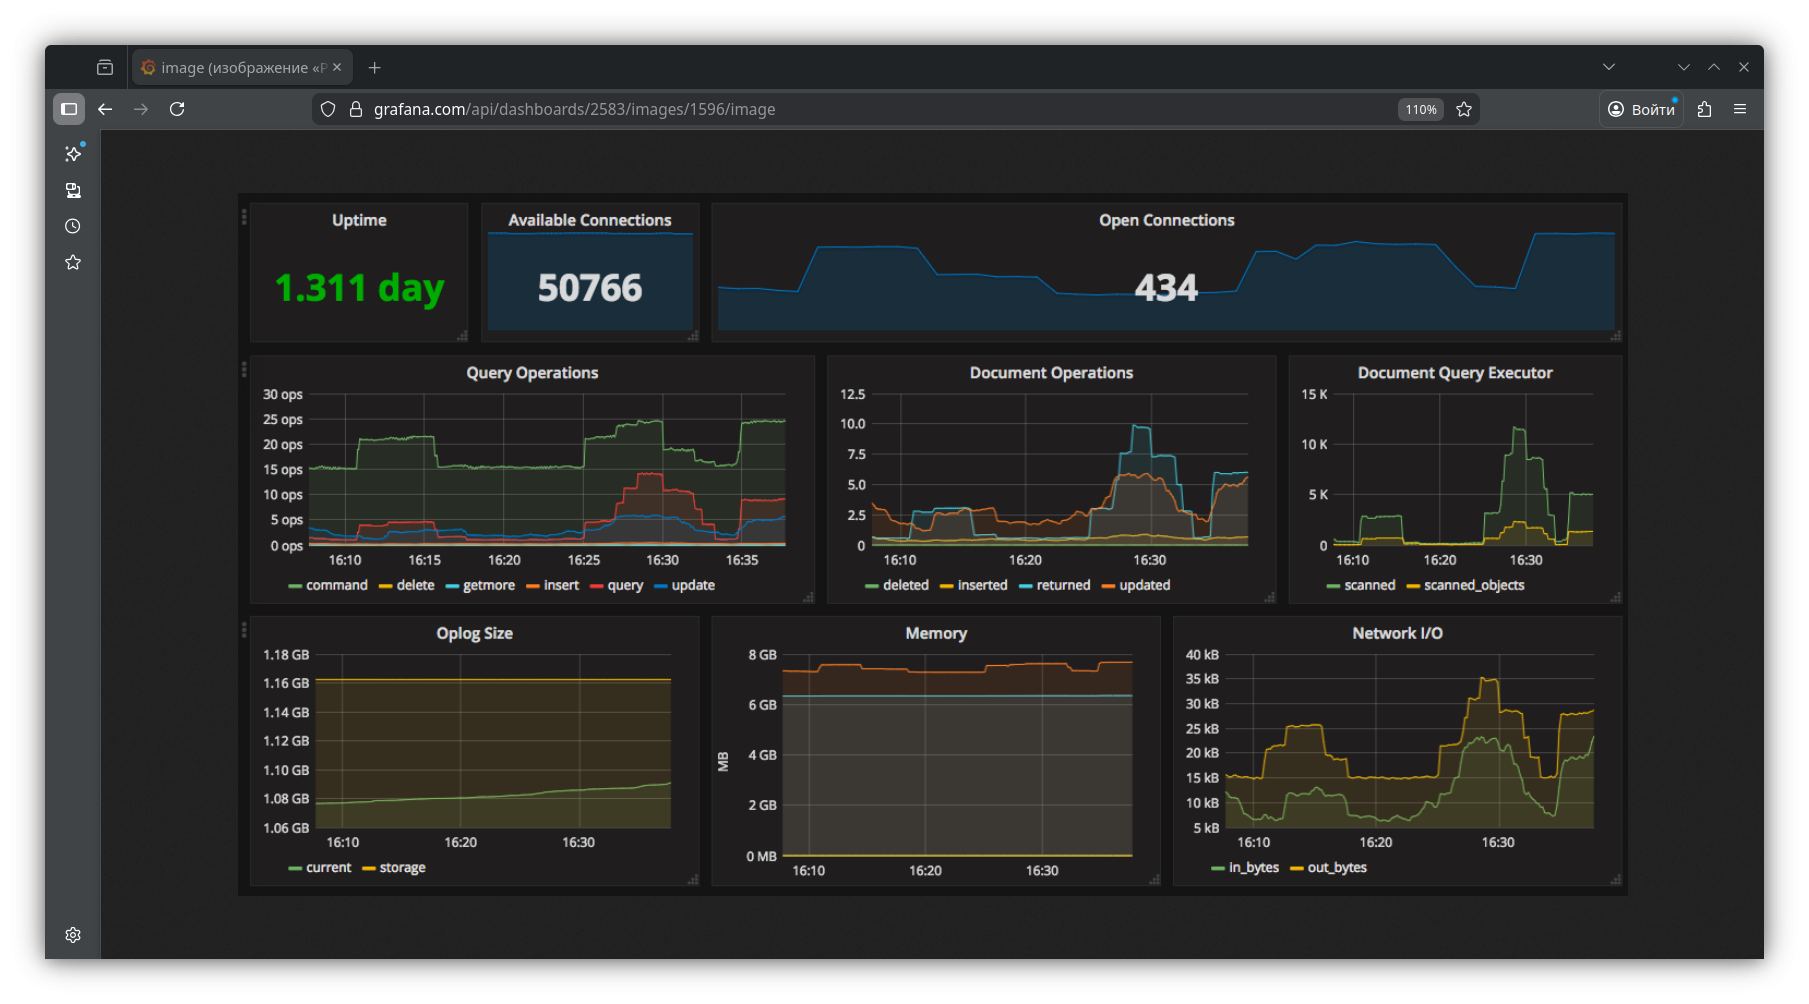 A dashboard is a set of panels on a single page. A panel can be a chart, table, status indicator, number, heatmap, and so on. The key to a good dashboard is not trying to show everything at once. What matters is answering concrete questions: “Is everything OK?”, “Where is the bottleneck?”, “What changed after the release?”
Variables
Variables make dashboards “live.” The same dashboard can be switched between environments, data centers, clusters, services, or instances. This removes the need to create dozens of nearly identical pages and makes navigation much more convenient.
Alerts
Grafana doesn’t just display data — it can react to it. It compares metrics to thresholds, detects anomalies, and sends notifications to your chosen channels.
Access and roles
In teams, it’s important that dashboards don’t turn into chaos. Grafana supports users, teams, roles, and permissions. You can separate workspaces by project, restrict editing, and allow broad read-only access. This helps keep things organized and reduces the risk of accidental changes to critical dashboards.
Common data sources used with Grafana
The most common setup is connecting a metrics storage system and building infrastructure and application dashboards. For logs, Loki or Elasticsearch/OpenSearch are often used. For tracing, Tempo or Jaeger. Grafana also works with InfluxDB, PostgreSQL, MySQL, and many other systems.
One principle is worth keeping in mind: you choose a data source based on the task, and Grafana helps visualize and connect everything together. That’s why it works equally well for small infrastructures and complex distributed systems.
What is usually monitored in Grafana
Grafana’s practical value becomes clear when dashboards reflect real risks. Most teams start with the basics: load, memory, disk, network, uptime. But fairly quickly the focus shifts to what directly affects users.
For a web service, for example, it’s not just CPU and RAM that matter, but also:
— response time over time and by percentiles;
— request volume and distribution by endpoints;
— error rates and exception spikes;
— queue and connection pool saturation;
— database health: slow queries, locks, replication status.
Grafana Cloud vs self-hosted: what to choose
Grafana can be used as a cloud service or deployed on your own infrastructure. The choice depends on what matters more to you: fast startup and lower operational overhead, or full control over infrastructure, configuration, and environment.
The cloud option is usually easier to get started with: less manual maintenance, faster onboarding, simpler scaling. Self-hosted setups are often chosen when there are requirements for isolation, privacy, integration with internal networks, or when the team wants full control over the monitoring system’s lifecycle.
For hosting Grafana and related components (such as Prometheus for metrics and Loki for logs), teams typically choose VPS or dedicated servers with fast storage and predictable networking. This is where THE.Hosting’s server offerings fit well: the company provides virtual and dedicated servers suitable for self-hosted monitoring. You can deploy a separate Grafana instance, allocate resources for metrics and log storage, and scale capacity quickly when needed without migrating to another platform. If monitoring is business-critical, it’s often best to keep it on a separate server so it remains available even when production systems are having issues.
In both cases, one thing remains constant: Grafana delivers value not by itself, but when it’s surrounded by well-defined data sources, carefully designed dashboards, and healthy alerts.
Conclusion
Grafana is a convenient and flexible tool that helps turn scattered technical signals into a clear picture: what’s happening in the system right now, how it changes over time, and where to look for the root cause of problems. Its strength lies in its versatility — Grafana is equally suitable for server monitoring, application behavior analysis, and observability of complex distributed services.